Dating and Drinking
- Project URL: Dating and Drinking
- Medium URL: The Social Symphony of Sips: Decoding Dating and Drinking with Tableau
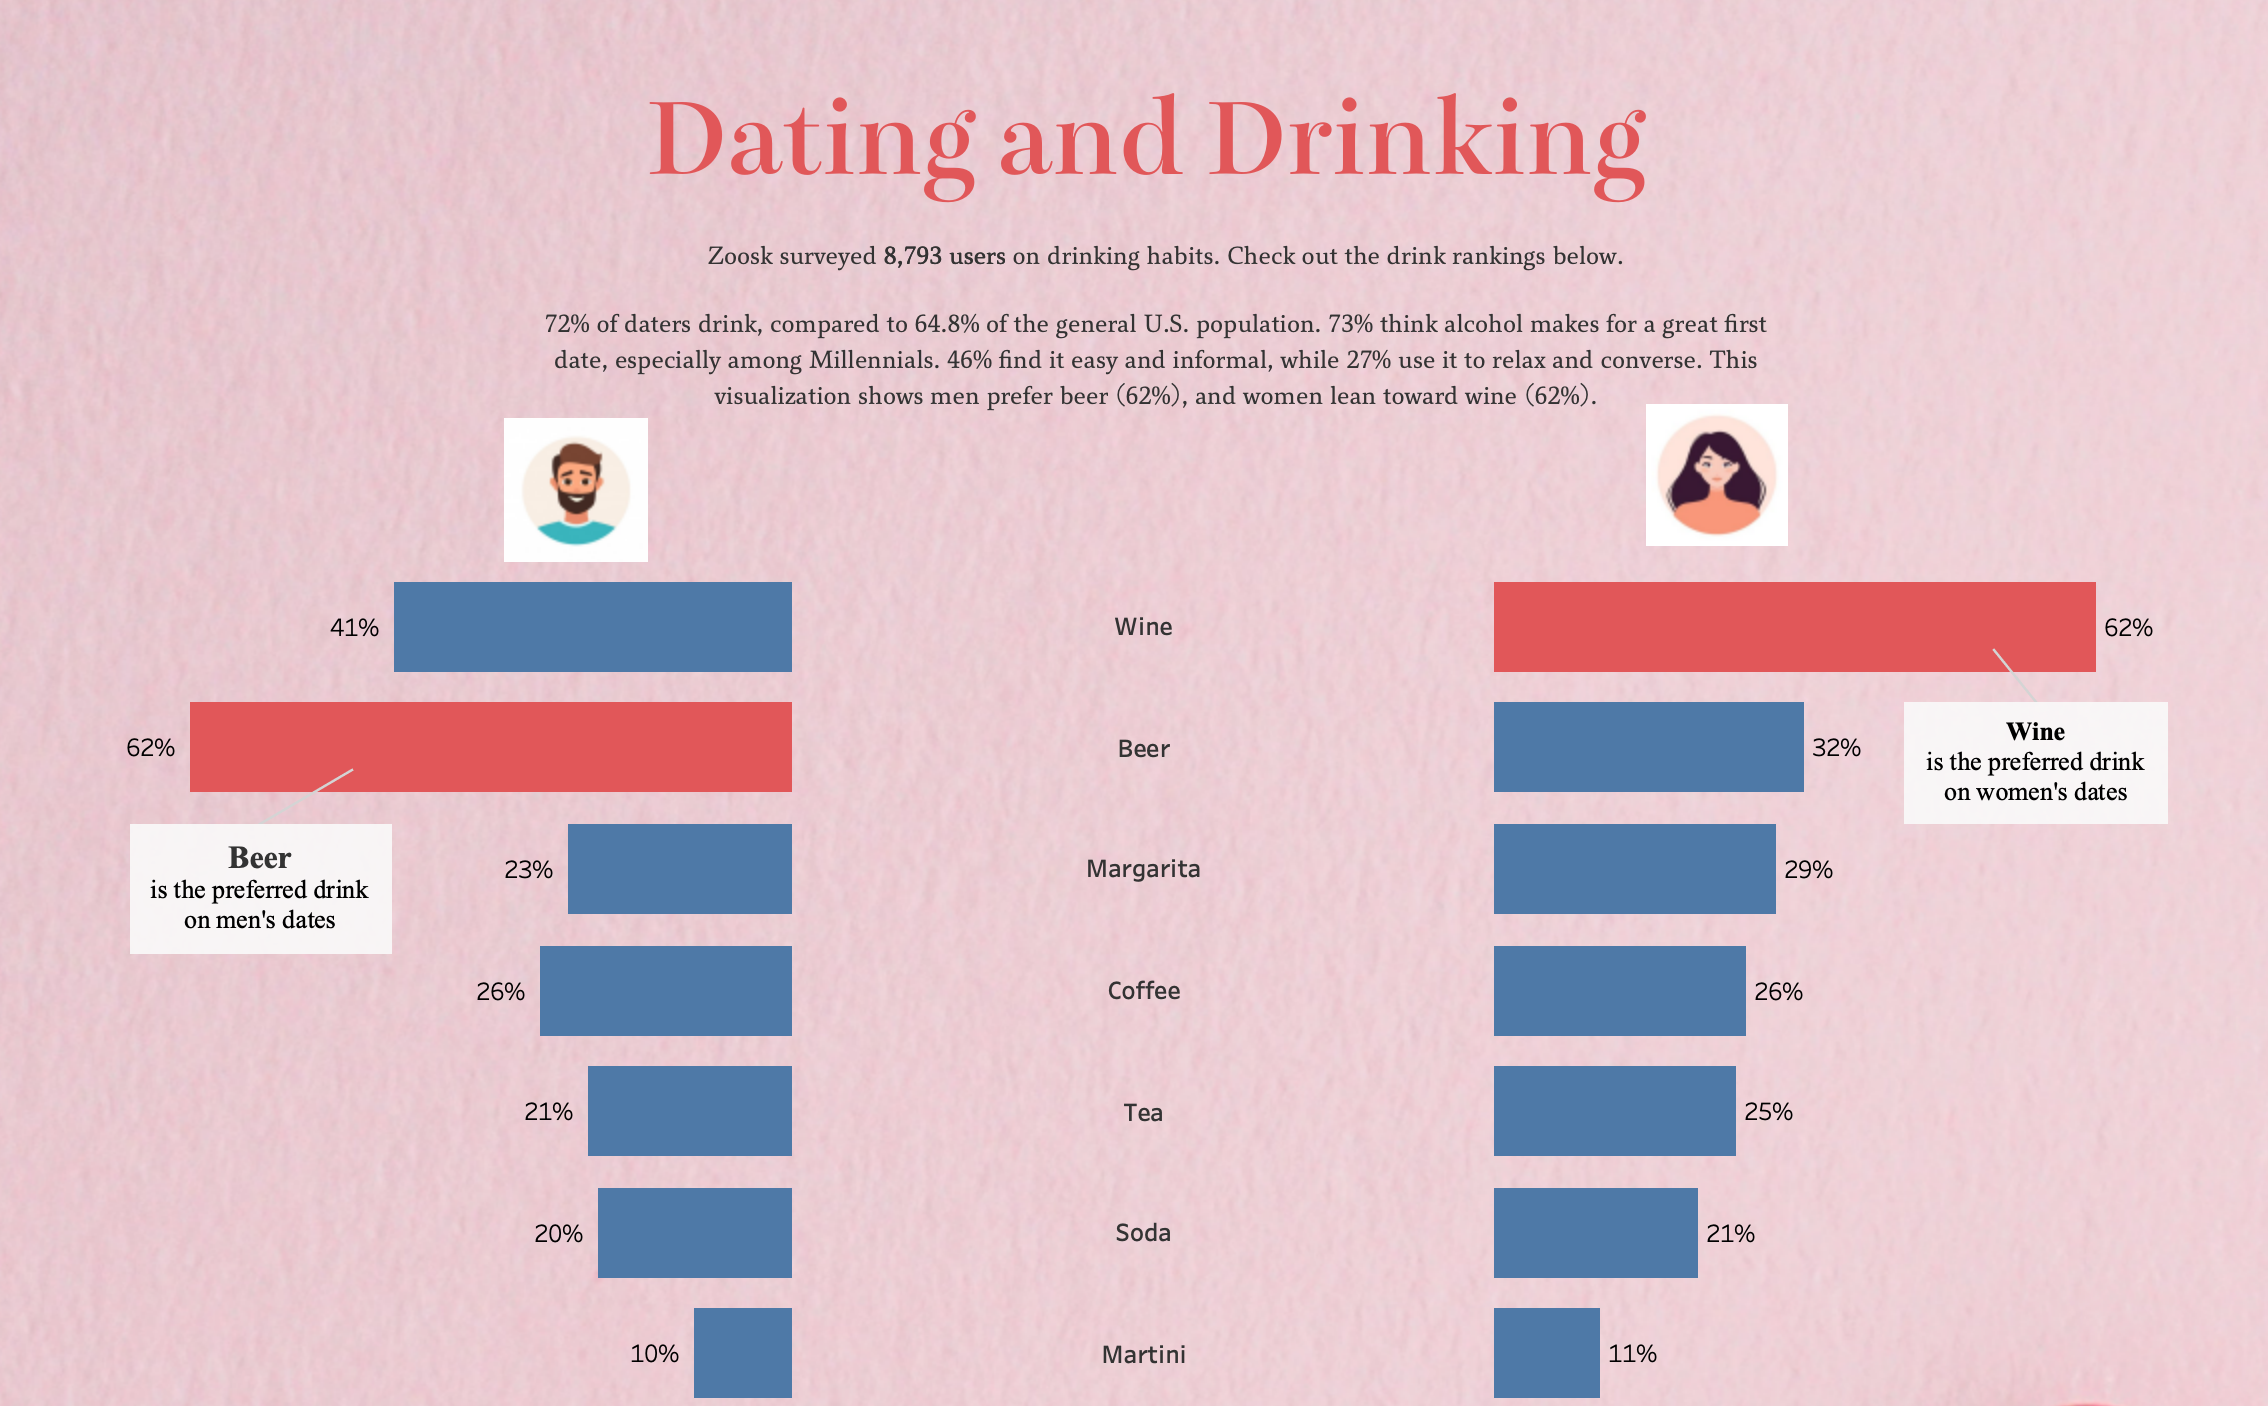
The Tableau dashboard showcases a butterfly chart to compare drink preferences between genders, revealing insightful trends. The dashboard highlights that 72% of daters drink alcohol, surpassing the U.S. average, with Millennials viewing it as a key icebreaker on dates. It also uncovers gender-specific preferences, with men leaning towards beer and women towards wine, while showcasing the popularity of non-alcoholic options among daters, indicating a wide spectrum of tastes.